
Decarbonize the Grid
A brief look at the monumental challenge of upgrading and building out a distribution system for clean electrical energy while demand surges globally.
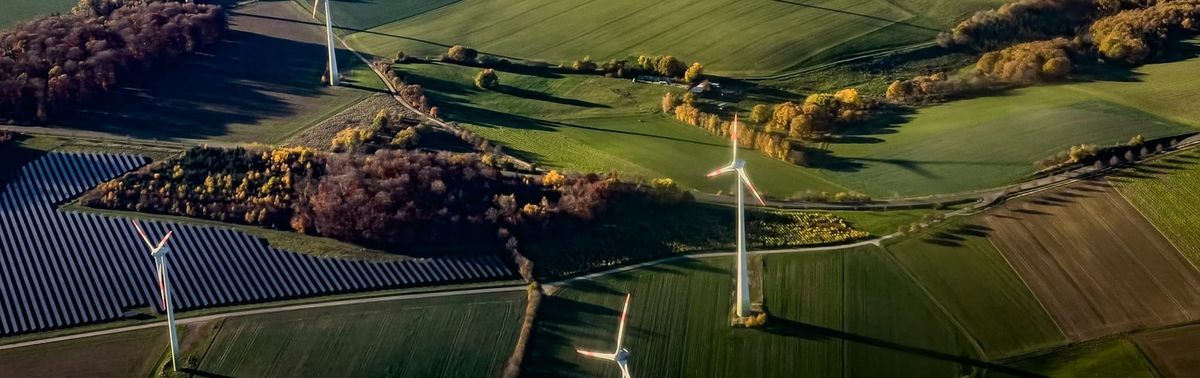
In our last post on electrification, we looked at how the carbon impact of device electrification is only fully realized with a Decarbonized Grid.
Progress is encouraging. The economics of wind and solar generation are now comfortably superior to fossil fuels, but there's far more to decarbonizing the grid than merely replacing fossil fuel generation with the equivalent capacity in wind and solar generation. Repurposing the grid for decarbonized power is an enormous undertaking, requiring $21T investment by 2050 according to BloombergNEF forecasts1 and adding or refurbishing a total of over 80 million kilometres of grids by 2040, the equivalent of the entire existing global grid according to the IEA2.
In this post we look at the many challenges that arise in preparing the grid for a far higher proportion of renewables.
The main steps to a decarbonized grid
It's hard to overstate the challenges faced in preparing the Grid to accommodate the surge in renewable energy.
- Polluting energy plants must be replaced with clean generation
- Clean energy sites must be located where the sun shines and the wind blows
- Clean energy must be moved in bulk from these new locations
- Operators must keep grids stable and balanced without the ballast that fossil fuels have historically provided
- All while global grid demand surges to at least double in three decades
Though coal is the dirtiest of fuels, and nuclear the most emotive (see sidebar on Nuclear), they deliver stability & predictability through the inertia that rotating turbines provide. Coal has been progressively overtaken by LNG or LPG (fossil-fuel gases) in market share. While relative share has fallen, coal remains stubbornly high in absolute terms with over 2,000 coal-fired plants globally in 20233
Decarbonizing the grid means retiring most of this carbon intensive capacity and switching to a more variable class of generating capacity - Wind, Solar, Geothermal, Hydro, Biomass - and then managing a far greater scale of energy flows through the grid infrastructure, all as the grid doubles in length and trebles in capacity by 2050.
Clean Power is substantially cheaper
The good news is that clean power generation is unequivocally cheaper, driven principally by the precipitous decline in solar and wind costs over the past decade. And this is before any geopolitical cost is priced in (data from Lazard LCOE reports4).
According to the IEA5, renewables accounted for 32% of global electricity generation in 2024 — up from 30% in 2023 and 29% in 2020 — and are projected to reach 43% by 2030 as solar and wind continue to accelerate.
Investment ratios have shifted substantially in the right direction — the chart below shows how the picture has changed since 2015.
Global Energy Investment: Clean Energy vs Fossil Fuels, 2015–2025
Annual investment in $bn. Hover bars for detail. Clean energy investment has more than doubled since 2015 and now runs at 2:1 over fossil fuels.
of clean energy investment
$2.2T vs $1.1T
Current projected additions to the US grid are striking, according to the EIA6. Despite political resistance and the sunsetting of incentives, an estimated 93% of new generating capacity added to the US grid in 2026 comes from renewables. In China, renewables now represent over 60% of total installed generating capacity7 — though coal still dominates actual generation. At this scale of deployment, the economics of clean energy appear to have taken on a momentum of their own.
Planned U.S. New Electric Generating Capacity Additions, 2026
86 GW of utility-scale capacity planned — a record if realised. Hover segments for details.
The transformation of the grid has two primary drivers. The share of renewables in the energy mix is forecast at 88% (up from 30% in current share), while a successful drive to Electrify Everything pushes demand to almost 3X8 - all to occur by 2050 in the NZE scenario.
Repurposing the grid requires:
- New transmission links to bulk renewable generation sites
- New interconnections between grids to move bulk energy across regions
- Vastly greater storage capacity to smooth out the supply of renewables
- Distribution capacity upgrades to handle almost 3-fold growth in consumption
- Infrastructure upgrades to take full advantage of “Distributed Energy Resources”
- Widespread adoption of Smart Grid technology
- Adoption of new technologies and practices for the purposes of maintaining a balanced and stable grid where power is drawn from predominantly decarbonized sources
The connection queue for new wind and solar developments provides a good barometer of grid preparedness. Unfortunately, connection delays measure in gigawatts and up to years in duration. In many cases, decarbonized generating capacity is installed and ready to contribute but unable to connect - a particularly frustrating gridlock.
Governments and authorities must move faster. Policy development must accelerate. The regulatory & permitting landscape is lagging way behind where it needs to be in many jurisdictions. In many respects, this problem reflects a grid that's based on a 100-year-old paradigm (i.e. fossil fuels as the dominant energy source).
Our next post outlines how Electrical Power Grids have evolved to their current state.
Further Listening
🎧 Bloomberg NEF podcast - Power Grids: The Backbone of the Race to Net Zero Note some key data points as follows:
- we're going to have to effectively double the size of the global electricity grid by 2050 and .. change the way that it operates .. to become smart, flexible, responsive, and enable renewable power to move around .. the grid of today is at its breaking point of what it can handle and starting to affect the development timelines for wind and solar
- if you add up all the kilometers in the world both transmission and distribution is ~72M km, and when we do our modeling .. it grows to ~152M km. .. a 2.7% compound annual growth rate [whereas] .. historically, it's been growing at about 1%
- in UK, Italy, Spain, Germany & France, .. ~ 600GW waiting for an interconnection ... That's about twice as much installed capacity from wind & solar as we have today and 80% of the 2030 targets for the EU... The waiting times are also growing .. anywhere from 3-8 years .. just for the grid interconnection (not even including things like environmental and construction permits). When you get to that point, the development timelines now can be so long that it's putting 2030 targets at risk.
Videos worth watching
Links shared in good faith, E&OE, we have no connection with any of these organisations
Further Reading
- 📖 By Ula Chobrak, writing for PopSci - Solar power got cheap. So why aren’t we using it more?
- 📖 From phys.org - Coal still top threat to global climate goals
- 📖 From Ember, an energy think tank - Half of the world is past a peak in fossil power
References
- BNEF (2023): Global Net Zero will require $21 Trillion Investment in Power Grids
- From IEA, October 2023 - Electricity Grids and Secure Energy Transitions – Analysis
- From globalenergymonitor.org - Global Coal Plant Tracker
- From article citing Lazard data - Wikipedia
- From the IEA Global Energy Review 2025, Electricity - Renewables collectively accounted for one-third (32%) of global electricity generation in 2024. CC BY 4.0.
- From EIA - New U.S. electric generating capacity expected to reach a record high in 2026
- From the National Energy Administration of China — Renewables account for over 60% of China's power capacity in 2025, January 2026
- An updated roadmap to Net Zero Emissions by 2050 - World Energy Outlook 2022 – Analysis - IEA